
Case study · Avangard Reklam · Apr 22 – Aug 22, 2026
Four months on our own site: a measured log of an SEO system
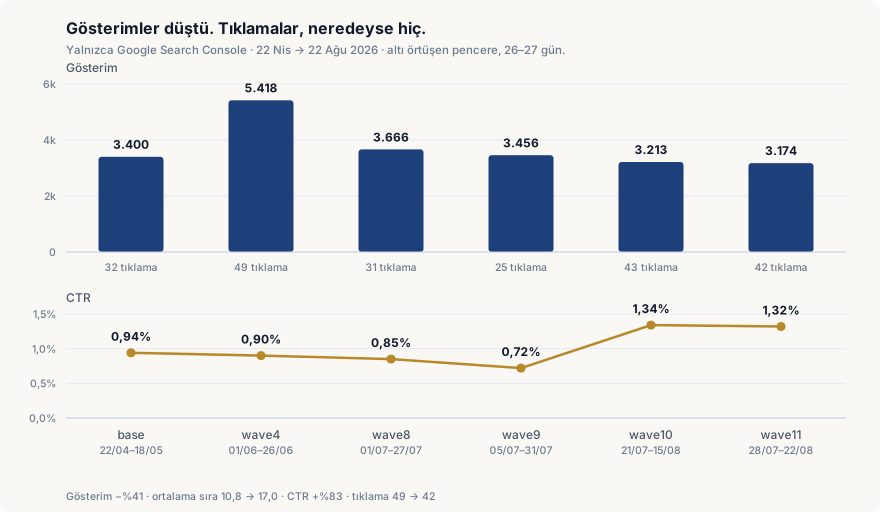
Let’s say it up front: This is not a “we 10×’d traffic” story. Over the four months we measured, the site’s search impressions fell 41% and its average position regressed from 10.8 to 17.0.
Transparency: marketingdigitalmendoza.com is not a client site; it is our own R&D property, operated by Avangard Reklam. That is why we can publish the failed attempts too.
What four measured months produced
- −41%
- Search impressions
- 5,418 → 3,174
- 49 → 42
- Clicks
- with 41% fewer impressions
- +83%
- CTR
- 0.72% → 1.32%
- 9.0 → 13.2
- Clicks per 1,000 impressions
- Our primary reported metric
Read these four numbers together: while impressions fell 41%, clicks nearly held, and a far larger share of the remaining impressions converted into clicks. This entire page explains how that table came about, which failures caused it, and which measurement system caught it.
Source: Google Search Console (GSC only, Bing excluded) · overlapping 26–27-day windows · evidence.json
00 — Transparency
Transparency note: this is not a client case
marketingdigitalmendoza.com is our own property. An R&D property operated by Avangard Reklam, active in the city of Mendoza, Argentina.01 — The property and the method
Turning measurement into a habit
app/ there are 83 pages — 19 local service pages, 7 free tool pages, roughly 29 blog posts, and the core service/corporate pages.lib/seo/route-seo-config.ts holds the title, description and canonical for every route. Instead of hunting metadata across 83 separate files, we audit it from one place.alternatesForPath() function in lib/seo/locale-route-policy.ts emits the en alternate only if that route actually exists in the English tree. The English version is deliberately a narrow 5-page subset; generating English hreflang for all 83 pages would have created an army of tags pointing at pages that do not exist. The same file throws an error when the development environment encounters a missing localized route — so broken links land on the developer’s screen, not in production.run-id, so that a past measurement can be recomputed later. Every number in this case study has been recomputed from those raw files.02 — Field study
Radiografía Web Mendoza: measuring the field instead of the competitors
<title> tag. Those that failed verification were not counted as “has a site”; they were marked as “no verifiable website of their own”.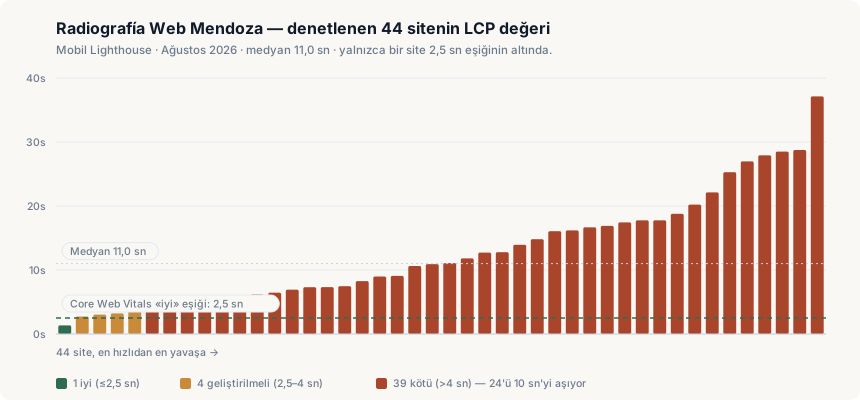
| Metric | Result |
|---|---|
| Median LCP (mobile) | 11,002 ms |
| Below the 2.5 s threshold | 1 of 44 sites |
| Over 10 seconds | 24 sites |
| Over 20 seconds | 8 sites |
| Median performance score | 62 |
| HTTPS | 100% |
| Meta description | 79% |
| H1 tag | 63% |
| Structured data (schema) | 60% |
| WhatsApp link | 46% |
Source: Radiografía Web Mendoza — 44 valid LCP measurements · anonymized open dataset (CC BY 4.0)
03 — Failure log
The wave system — including the part that failed
Why it happened
The 301 never fired
diseño web cluster into a single strong page, and defined 301 redirects for the old URLs. The redirect never took effect: the hosting layer preferred serving the exported static file over a _redirects rule without the force flag. The result: we paid the cost of consolidation (scattering the old pages’ authority) and never received the benefit (concentrating that authority on one page).Our measurement document attributes roughly 27% of the impression loss to this single fault.
7 of 8 new pages received zero impressions
7 / 8 pages invisible · intent collision
What we did
| Metric | Wave 4 | Wave 9 | Wave 11 |
|---|---|---|---|
| Impressions | 5,418 | 3,456 | 3,174 |
| Clicks | 49 | 25 | 42 |
| CTR | 0.90% | 0.72% | 1.32% |
| Clicks per 1,000 impressions | 9.0 | 7.2 | 13.2 |
Source: Google Search Console (GSC only) · window totals, not a mean of daily CTRs
And one surprise
04 — Performance
Performance: misdiagnosing LCP twice
Stage one — fonts
weight: [400, 500, 600…]). This produced 13 separate woff2 files, 5 of which (~196 KB) were preloaded at page open. Meanwhile the page’s LCP element was a text element: the browser was downloading hundreds of kilobytes of fonts before it could paint the text.Fraunces (headings) and Inter_Tight (body), display: swap, with only the latin subset. latin-ext was dropped because Spanish accents are already inside latin. 13 files became 2.Stage two — the actual culprit
opacity: 0. Chrome does not count an element at opacity zero as painted. So the LCP clock waited for the 572 KB bundle to hydrate and the animation library to run.y axis only. Transforms (transform) do not block painting. That change also closed a hidden accessibility bug — for users with the “reduce motion” preference enabled, that paragraph was not visible at all.05 — Measurement and conversion
The measurement and conversion stack — and the number we do not publish
Analytics
lib/analytics/funnel-events.ts: primary_cta_click, whatsapp_click, contact_click, form_submit, tool_complete. Every event carries the page_type, cta_location and service_type dimensions and is sent to both dataLayer and gtag.Conversion-side decisions
- 01
WhatsApp first, form second.
Filling a contact form and waiting for an email is not an established behaviour in the Argentine market. So the contact form does not send data to a server; it converts the fields into a formatted WhatsApp message and opens the conversation. The user stays in a familiar interface at a familiar pace.
- 02
Context-aware opening.
The WhatsApp component composes a different opening line depending on the page the user is on — someone coming from the Google Ads page does not meet the same message as someone coming from the SEO page.
- 03
Removing one redirect hop.
Links use the api.whatsapp.com endpoint directly instead of wa.me; wa.me inserts a 302 redirect in between.
- 04
The silent bot trap.
The form has a hidden “honeypot” field; clients that fill it receive not an error but a fake success. The bot never learns it was blocked.
- 05
Exit intent, without aggression.
The popup has three triggers, but all three are gated: at least 8 seconds on the page, 20 seconds of inactivity, and a 24-hour re-show block.
Where we have to stop and be honest
We do not publish a conversion rate in this section. For two reasons: there is no stored GA4 export in the repository, and at this traffic volume (25–49 clicks per 28 days) any conversion rate computed from it would be statistically meaningless. Rather than invent a number, we leave the gap empty.Scaled pages: let’s call them what they are
marketing-digital-maipu, seo-godoy-cruz, meta-ads-lujan-de-cuyo and the rest) are hand-written files that render a single shared component (LocalLandingPage.tsx). That is templating at the component level, not pages generated from data. There are only three genuinely dynamic route types: service details (in two languages) and blog categories.Structured data
lib/seo/schemas.ts: LocalBusiness, ProfessionalService, Service, FAQPage, BreadcrumbList, Offer, AggregateRating, OpeningHoursSpecification and others. Being central means it can be audited from one place instead of hand-copying JSON-LD across 83 pages.Pricing: an architectural fix for a content problem
06 — Outcome
What we learned
- 01
An unmeasured redirect is a redirect never made.
A single silent fault cost about a quarter of the four-month impression loss.
- 02
More pages does not mean more visibility.
7 of 8 new pages received zero impressions. Before producing a page, the question is not “which query will this page win?” but “which of my pages already targets this query?”
- 03
An impression is not a metric; it is raw material.
Keeping clicks while losing 41% of impressions beats gaining impressions while losing CTR. That is why our primary reported metric is clicks per 1,000 impressions.
- 04
Performance bugs usually are not in the CSS.
Both of our LCP diagnoses were wrong places: one in the font loader, one in an animation’s opacity value.
- 05
Produce your own data.
The Radiografía study was this project’s most valuable output, and it had nothing to do with rankings. The measurement cost — API spend included — was $0.58.
07 — Method
Method and limitations
Search Console data
marketingdigitalmendoza.com, a https:// prefix property. Every measurement is written to disk as raw JSON under its own run-id.- 01
Windows are 26–27 days, not 28.
Because of Search Console’s data delay, “28-day” pulls effectively contain 26–27 full days. Comparisons should therefore be read through rates (CTR, clicks per 1,000 impressions) rather than absolute totals.
- 02
Windows overlap.
Wave 9 (July 5–31) and wave 10 (July 21 – August 15) share 11 days. The 9→10 change is therefore not a comparison of two independent periods. We still report the CTR improvement because it held at 1.32% in wave 11 (July 28 – August 22); had it rested on a single window, we would not report it.
- 03
Volume is low.
25–49 clicks per window. At this scale, individual differences are not statistically significant. Our claim is not the accuracy of a specific percentage but the direction sustained across six measurements.
- 04
Causality is not proven.
Seasonality, algorithm updates and competitor moves were not controlled. The relationship between our changes and the observed shifts is temporal, not experimental. No A/B test was run.
Radiografía Web Mendoza field study
<title> tag. Non-matches were not counted as “has a site”; they were marked “no verifiable website of their own”. This deliberately under-estimates the website-ownership rate (56%) — in every uncertain case, we said “no”.- 01
One-shot measurement.
Each site was measured once, from one point, one time. Lighthouse is lab data, not real-user measurement (CrUX/RUM). A site being slow at that moment does not mean it is always slow.
- 02
Small cells.
Audited site counts per sector range from 0 to 10. Medians for sectors like veterinarians (3 sites) or dentists (2 sites) are indicative, not decisive. Bodegas (10 sites) is the most reliable cell.
- 03
One row could not be classified.
1 of the 52 rows could not be matched to a sector because the domain changed after a redirect, and is published as “desconocido” (unknown) in the dataset.
- 04
Google’s local pack is not a universe.
The sample consists of the businesses visible in those searches at that time; it is not a representative sample of all businesses in Mendoza. It skews toward businesses that already have visibility — meaning the true situation is probably worse than what we measured.
Performance claims
What we did not publish
- 01
No conversion rate.
There is no stored GA4 export in the repository, and the contact form does not send data to a server (it defers to WhatsApp), so there is no server-side lead record either. A conversion rate at this volume would be meaningless anyway.
- 02
No revenue.
The commercial outcomes of this property are outside the scope of this study.
- 03
No business identities.
The Radiografía dataset is anonymized: business name, domain, URL and address removed. Row IDs are a stable hash of the domain — irreversible for anyone who does not already know the source domain. Sector and all metrics are preserved.
Correction policy
If we find a published figure on this page to be wrong, we add the correction here with its date rather than silently updating the page. No corrections so far.08 — Evidence files
Evidence and reproduction
- evidence.json (JSON)
Evidence file
Every figure in the text, matched with its source, measurement window and data source (Search Console only / Search Console + Bing).
- radiografia-web-mendoza.json (JSON, CC BY 4.0)
Open dataset
Radiografía Web Mendoza — 52 anonymized rows; business names, domains, URLs and addresses removed (CC BY 4.0).
Charts
Generated from the evidence file, not drawn by hand; the figures should be regenerated from the evidence file rather than redrawn.
Method and limitations
Covered in full as chapter 07 of this page; it documents how the data was produced and what it does not prove.
Bring measurement discipline to your own site
To build the same wave system — measure, publish, verify in the next window — on your own site, start with our SEO services or the free site speed test.